Resampling
Resampling / historical resampling, is a process that allows obtaining a sample of a data set. In this case, a set of observations to create climate scenarios. This is because the crop models need climatic variables on a daily basis. There are several ways to pass probabilistic data to daily data, such as Markov chains, through the generation of synthetic information by fitting distributions to the data or the historical resampling used in this process.
The resampling process has two inputs: the historical daily data, which is taken from the database that is configured in the Aclimate webadmin (explained in Importing data), of approximately 30 years per country and the probabilistic data generated by the forecast process using CPT. Additionally, the data is downloaded one month prior to the forecast, given that in the current crop modeling scheme, the necessary water balance must be carried out in the process.
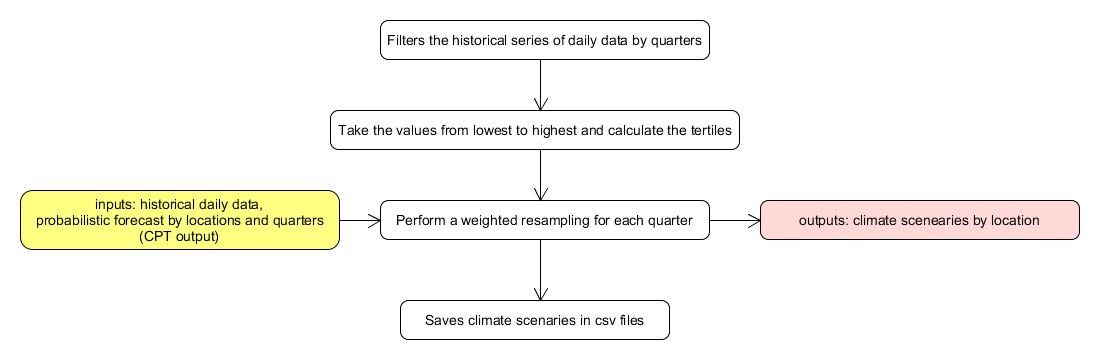
The resampling process begins by filtering the historical series of daily data by the quarters being forecast, takes the values from lowest to highest, and calculates the below-normal, normal, and above-normal tertiles. Once the historical data is organized into these three categories, a weighted resampling is performed with the forecast probabilities for each quarter. In the weighted resampling, one hundred iterations are carried out, in each iteration one of the years is randomly taken (historical data in tertiles) and it is stored in the set of scenarios that will be entered into the crop model. In this way, the hundred scenarios that were generated are distributed according to the probabilities of the climate forecast. That is, if the forecast says that there are 36, 24, 40 probabilities below, in normal, and above normal, respectively, then 36% of the hundred scenarios that enter the crop are below normal, 24% in normal and 40% above normal. This explains why the resampling carried out is weighted according to these tertiles.
The process is done for each quarter in order to have climate scenarios for six months. Seven taking into account that the first is one month before the forecast and necessary in the crop model for the water balance.
It is important to clarify that since the climate prediction is for precipitation, an assumption is made that since precipitation is the greatest driver for the rest of the variables (maximum temperature, minimum temperature, and solar radiation), then what happens with precipitation will happen for these variables. variables too.
Finally, there are climate scenarios for seven months that will later be used as input for crop models.
The structure of the hundred scenarios for each station/location consists of csv files with seven columns: day, month, year, maximum temperature, minimum temperature, precipitation, and solar radiation.
The following diagram describes the process mentioned above: