Forecast
Forecast app allows you to import a new forecast or import information to a previously created forecast, this allows you to store the information of probabilities, metrics, crop data, the 100 forecast scenarios for each weather station, rasters and other data included in the forecast.
To start importing, the folders obtained from the forecasting process must be prepared. The folders must have the following format.

cultivos: Contains the folders of each crop of the system with their respective data obtained from the crop models of the forecast.
prediccionClimatica: Contains the folders with the data of the probabilities generated by the forecast as well as the forecast metrics.
It also contains the resampling with the 100 scenarios for each weather station and the observed data generated to complete the scenarios in the countries where planting window is being used.
Finally it also contains the rasters that will be copied and stored.
To import forecast data you must access the path where ForecastApp is located through the console, either Linux or Windows.

Note
If you are using Windows it is recommended to use CMD.
To execute any ForecastApp command you must use the following line of code dotnet CIAT.DAPA.USAID.Forecast.ForecastApp.dll this will execute the file that will start the ForecastApp process, this command must be followed by the action you want to do.
To execute the import of the forecast data you must use the following command dotnet CIAT.DAPA.USAID.Forecast.ForecastApp.dll -in -fs -p “forecast ouput folder path” -cf value -frid value.

Note
The command consists of the following parts:
dotnet CIAT.DAPA.USAID.Forecast.ForecastApp.dll = This is the first mandatory part for all ForecastApp commands, it must be complemented with the command you want to perform.
-in = As this is an import process, the -in parameter must be used to indicate that a data import will be performed.
-fs = This parameter indicates that an import process of forecast will be performed, it is mandatory if you want to perform this process.
-p “ranges configuration file path” = The -p parameter indicates the path where the file to be imported are located, this parameter is followed by the path where this file is located, example: -p “C:\unified_outputs\outputs\”
In case you use a Linux operating system the path must be separated by / and in Windows you must use \.
Linux example: -p “/Daily-20221214T155614Z-001/Daily/Csv/Import/”
Windows example: -p “C:\Daily-20221214T155614Z-001\Daily\Csv\Import\”
-cf = This parameter indicates the confidence value for the intervals confidence. It is a float value. Example -cf 0.5
-frid = This parameter indicates the Id of a previously imported forecast, adding this parameter in the command will perform the import of the data on the supplied forecast. This parameter is optional. Example -frid “63b9c071368fee5585f307ed”
Once the command is prepared with all the parameters, copy the command in the console and press Enter, the process will perform the import of all data and once finished it will display the message Forecast imported.
Content of prediccionClimatica
Probabilities
Column |
Meaning |
|---|---|
year |
It is the year of the forecast. |
month |
It is the month of the forecast. |
id |
It is the id of the weather station to which the forecast data belongs. |
below |
It is the probability generated by the forecast which indicates that the values may be below normal having the indicated percentage. The value is a double between 1 and 0. |
normal |
It is the probability generated by the forecast which indicates that the values may be in the normal range. The value is a double between 1 and 0. |
above |
It is the probability generated by the forecast which indicates that the values may be above normal having the indicated percentage. The value is a double between 1 and 0. |
The probabilities file is one of the data imported from the forecast, it is located inside the probForecast folder. This file must have the following structure:
It must be a plain text file separated by “,” csv.
In values of type double, the “.” must be used as a decimal point.
The first row of the file is the header and should be in the following format:
year,month,id,below,normal,above
The following lines should contains the information to perform the importing of the soil data. Example:
2023,2,5e91e1c214daf81260ebba59,0.157616196,0.342055206,0.500328598
The following is an example of what the file would look like in the excel viewer

The following is an example of what the file would look like in text viewer

Metrics
Column |
Meaning |
|---|---|
year |
It is the year of the forecast. |
month |
It is the month of the forecast. |
id |
It is the id of the weather station to which the forecast data belongs. |
pearson |
It is the metric of climate models. |
kendall |
It is the metric of climate models. |
goodness |
It is the metric of climate models. |
canonica |
It is the metric of climate models. |
afc2 |
It is the metric of climate models. |
groc |
It is the metric of climate models. |
ignorance |
It is the metric of climate models. |
rpss |
It is the metric of climate models. |
spearman |
It is the metric of climate models. |
Note
Not all columns need to be present (Only year, month and Id are required)
The metrics file is one of the data imported from the forecast, it is located inside the probForecast folder. This file must have the following structure:
It must be a plain text file separated by “,” csv.
In values of type double, the “.” must be used as a decimal point.
The first row of the file is the header and should be in the following format:
year,month,id,pearson,kendall,goodness,canonica
The following lines should contains the information to perform the importing of the soil data. Example:
2023,2,5e91e1c214daf81260ebba59,0.157616196,0.342055206,0.500328598
The following is an example of what the file would look like in the excel viewer
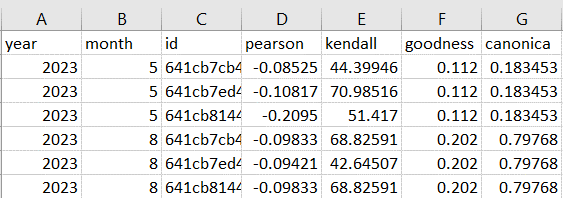
The following is an example of what the file would look like in text viewer

Scenarios
Column |
Meaning |
|---|---|
day |
Day of the month - number type |
month |
Month of the year - number type |
year |
Year - number type |
t_max |
Maximum temperature °C - double type |
t_min |
Minimum temperature °C - double type |
prec |
Precipitation mm - double type |
sol_rad |
Solar radiation MJ/m²d - double type |
The scenarios file is one of the data imported from the forecast, it is located inside the resampling folder. The resampling folder must contain a folder for each weather station and each of these folders must contain 100 scenarios.
The name of the folder must be the Id of the weather station and the name of the file must follow the following format:
weather station Id _ escenario _ number from 1 to 100
5eb346bdebd0050e38685f3e_escenario_1.csv
This file must have the following structure:
It must be a plain text file separated by “,” csv.
In values of type double, the “.” must be used as a decimal point.
The data it contains are: day, month, year, maximum temperature (t_max), minimum temperature (t_min), precipitation (prec) and solar radiation (sol_rad).
The first row of the file is the header and should be in the following format:
day,month,year,t_max,t_min,prec,sol_rad
The following lines should contain the information for this station. Example:
1,1,2022,30.67449154,22.67449154,0,16.37537505
The units of measurement for each variable are:
t_max = °C
t_min = °C
prec = mm
sol_rad = MJ/m²d
The following is an example of what the file would look like in the excel viewer

The following is an example of what the file would look like in text viewer

Import historical yield
To perform the import, a flat file must be prepared with the information for each weather station, soil and cultivar. This file must be in CSV format. Select the file from your device.

The source of the information must be selected.

Finally, click on the Import button.
Column |
Meaning |
|---|---|
weather_station |
weather station code - string type |
soil |
soil code - string type |
cultivar |
cultivar code - string type |
start |
date of initial planting - format (yyyy-MM-dd) |
end |
final planting date - format (yyyy-MM-dd) |
measure |
measure (yield_14 - yield at 14% moisture, yield_0 - yield at 0% moisture, d_har - days to harvest, d_dry - days to drying, prec_acu - cumulative precipitation, t_max_acu - cumulative maximum temperature, t_min_acu - cumulative minimum temperature, bio_acu - cumulative biomass, et_acu - cumulative evapotranspiration). |
median |
median - numeric type |
avg |
average - numeric type |
min |
minimum value - numeric type |
max |
maximum value - numeric type |
quar_1 |
first quartile - numeric type |
quar_2 |
second quartile - numeric type |
quar_3 |
third quartile - numeric type |
conf_lower |
lower confidence interval limit - numeric type |
conf_upper |
upper bound of confidence interval - numeric type |
sd |
standard deviation - numeric type |
perc_5 |
5th percentile - numeric type |
perc_95 |
95th percentile - numeric type |
coef_var |
coefficient of variation - numeric type |
The file must have the following format:
Line 1 should have the following heading:
weather_station,soil,cultivar, start,end,measure, median,avg,min,max,quar_1,quar_2,quar_3,conf_lower,conf_upper,sd,perc_5,perc_95,coef_var
The following lines contain the production history information. Example:
58504f5d006cb93ed40eec4e,5851ab2c47847d1f144b83ff,58505210c290272c481111b1, 1980-01-01,1980-01-05,yield_14, 8582.2,8582.2,8582.2,8582.2,8582.2,8582.2,8582.2,0,0,0,8582.2,8582.2,0
The following is an example of what the file would look like in the excel viewer

The following is an example of what the file would look like in text viewer
